")
When considering measuring and tracking body composition data to achieve health goals, it’s important to understand not only what each testing method entails, but what data is actually produced from a report. Lizeth, a client from Composition ID in Washington, DC, ran an experiment to compare a Styku 3D scanner report and a DEXA report to assess nuances between data collected form each device.
What does the same body look like when two completely different body composition tests are applied? Lizeth took both a 3D scan with a Styku device and a DEXA scan using DXA technology to see how both reports compare.
At first glance, there are considerable visual differences between the two reports. Most notably, the DEXA scan report is twice as long as the 3D scan report (6 pages versus 3, respectively). A typical 3D scan report shows a full outline of the body’s dimensions across three planes of space, whereas a DEXA report displays a 2D version of the body with colors differentiating fat, muscle, and bone tissues. While both provide a general sense of body shape change over time, by taking a deeper look, it’s apparent that a 3D scan may not tell the whole story of what lies beneath the skin when it comes to fat and muscle mass composition.
3D Scan Report
What it shows
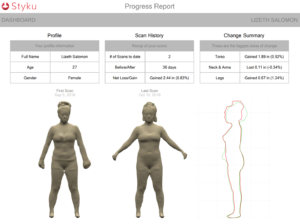
By exploring the 3D scan report in-depth, it includes general information on overall and regional change in body shape measured in inches. In Lizeth’s case, over one month, she gained 2.44 inches over her entire body, with 1.89 inches gained in her torso, 0.11 inches lost in her neck and arms, and 0.67 inches gained in her legs.
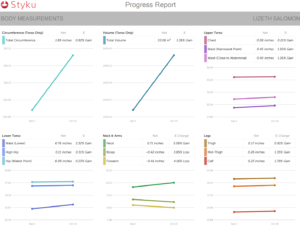
The report moves on to show standard and volumetric regional measurements displayed as trends between scans. Percentages of inches gained/loss in the torso, neck, arms, and leg regions are provided next to net change measurements derived from the machine’s scanning screen. Graphical trending data from previous scans provide a sense of actual measurement changes over time, with color coded line graphs.
What it doesn’t show
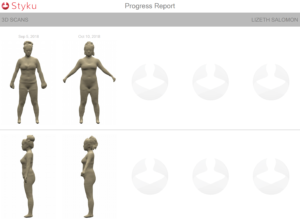
Apart from not measuring bone density or visceral fat, the 3D scan report does not differentiate between lean mass and fat mass changes within the body. The scan does not provide left and right regional differences in body composition, which can be essential to asses body imbalances. A 3D scan also shows varying postures of the body depending on how a person stands during the test. In this case, Lizeth has slightly different stances in the first and second scan. Finally, the 3D scan report shows an outline of Lizeth’s full body – including the outline of her clothes and hairstyle. While it’s hard to determine exactly, these small nuances may contribute to data calibrated on subsequent pages.
DEXA Report
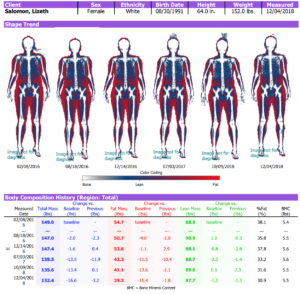
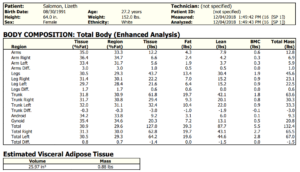
What it shows
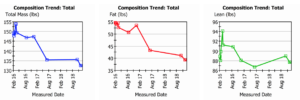
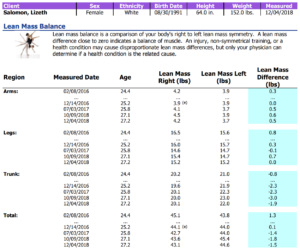
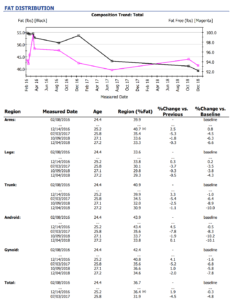
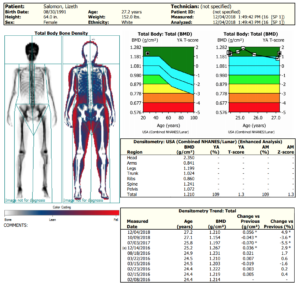
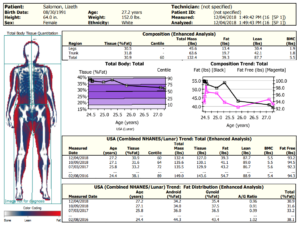
Looking at Lizeth’s DEXA report, the visual body component displays a flat image of her body outline, with red, blue, and white regions differentiating between fat, lean, and bone mass. A breakdown of fat verses lean mass changes over time (both in pound measurements and percentages) is provided below. Regional measurements and percent change from previous scans are displayed in both chart and graphical formats, which give a glimpse into any muscle imbalances between left and ride sides of the body.
Additional data, including bone density and visceral fat measurement are calculated to provide further information on Lizeth’s general internal health.

What it doesn’t show
DEXA scan provides a 2D rendition of body shape and does not measure standard or volumetric inches around the body. Scan imagery is different in a DEXA report, with no outline of clothing worn during the test, but rather an X-ray image of the body.
When to Choose DEXA vs a 3D Scan
When choosing a test, think about the information you’d like to walk away with. If total body measurements in inches, volume, and general changes over time are sufficient, a 3D scan may be appropriate. However, inches gained or lost only scrapes the surface of what may be occurring in the body, especially when a nutrition and/or fitness plan is applied over time.
A DEXA scan report dives deep into full-body analysis of both body fat and lean mass, which can be an important distinction to make when given body composition data. It also provides both mass measurements and percentages, and assesses regional differences in body fat and lean mass – all of which are useful to accurately track progress over time to achieve health and fitness goals.
Schedule a DEXA scan with our experts at a location near you!